
Distance for WiFi: How Far Your Network Really Reaches
Distance for WiFi depends on band, walls and access point placement, not one radius. See UK range benchmarks, a link budget method and practical fixes.
A WiFi Analyser Application shows signal strength, channels and interference. Learn the key metrics, MSP survey workflows and selection criteria that matter.
Changing the Wi-Fi channel isn't the first fix for every slow connection. It's a configuration change that needs evidence. A channel scanner can help explain crowded airtime, but it can't prove that your broadband service, gateway or authentication system is healthy.
For MSPs and resellers, the useful question isn't which app produces the most colourful graph. It's which measurement will isolate the fault. Choose a tool that answers that question, capture repeatable readings, and keep local wireless performance separate from internet performance.
A WiFi analyser application measures the radio environment around a device, rather than testing connection speed alone. The right application follows the job: finding a weak corner, assessing channel contention, planning access-point placement or investigating failed connections.
The category has long outgrown specialist desktop troubleshooting. A 2015 Tech Monitor review recorded between 10 million and 50 million global installations for the Android WiFi Analyzer application and described inSSIDer's graphical views and filtering by SSID, MAC address or channel.
Analyser types, example tools and best uses
| Analyser type | Example tools | Best for | Typical platform |
|---|---|---|---|
| Mobile channel scanner | WiFi Analyzer | Quick checks in a home or single room | Android phones |
| Desktop analyser suite | inSSIDer | Channel graphs and filtering by SSID, MAC or channel | Desktop, check current OS support |
| Site survey software | NetSpot or Ekahau | Heat maps and floor-plan surveys for planning | Desktop, confirm survey features in the chosen licence |
| Packet capture tool | Wireshark | Protocol-level fault diagnosis | Desktop, compatible monitor-mode adapter needed for wireless capture |
A homeowner investigating a dead corner can start with a mobile scanner. Walk towards the problem area, watch the serving access point's signal and note whether the device changes association. That's a useful first investigation without turning a household problem into a formal survey project.
An MSP planning an office deployment needs more. Floor-plan measurements, repeatable routes and exportable results matter because another engineer must be able to verify the design later. A screenshot of nearby networks won't establish whether meeting rooms have usable coverage.
Packet capture serves a different purpose. It can reveal protocol exchanges, retransmissions and connection failures, but capturing wireless management traffic requires suitable hardware and driver support. Installing Wireshark alone doesn't turn a laptop into a complete wireless diagnostic instrument.
Buying rule: Purchase the capability your investigation needs, not the longest feature list.
Before committing, test the application on the engineer's actual device. Operating-system permissions, adapters and drivers affect what it can collect. A field labelled noise or utilisation isn't useful if the application can't obtain that measurement reliably.
Answer these questions before shortlisting:
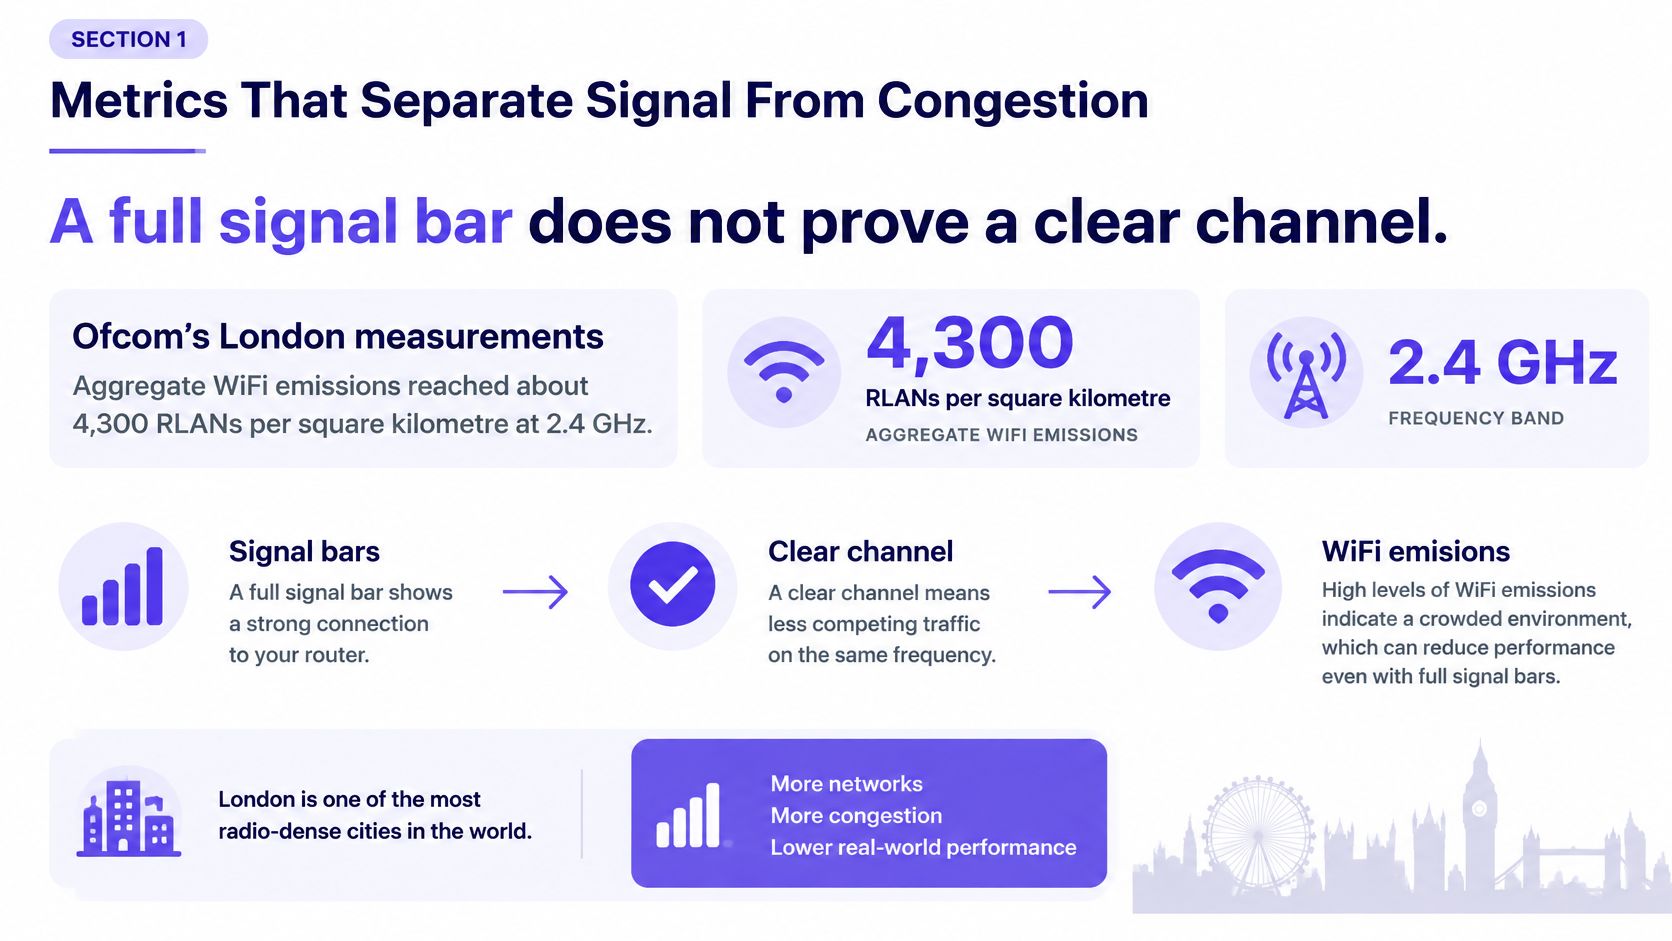
A full signal bar does not prove a clear channel. RSSI describes received strength, not how long a device must wait before transmitting.
Ofcom's airborne measurements found approximately 4,300 RLANs per square kilometre at 2.4 GHz, compared with about 2,200 at 5 GHz, over central London, according to its Wi-Fi airborne measurements dataset. Those are measurements of that environment, not a prediction for your customer's building. They illustrate why band and location belong in the diagnosis.
Key WiFi metrics, reference readings and traps
| Metric | What it tells you | Typical reference | Trap to watch for |
|---|---|---|---|
| RSSI | Received signal strength at the device | Application requirement, validated with the actual client | Strong RSSI can still sit on a busy channel |
| SNR | Signal above the noise floor | Sufficient margin for the required modulation and workload | A quiet noise floor doesn't guarantee good SNR |
| Noise floor | Background radio energy | Stable against the site's quiet baseline | A rise needs investigation, not an automatic interference diagnosis |
| Channel utilisation | Share of airtime that is busy | Compare quiet and busy operating periods | High utilisation with good RSSI suggests congestion |
| Co-channel BSSIDs | Access-point radio identities sharing your channel | Assess count alongside signal strength and activity | Visible network count isn't an airtime measurement |
| Data rate | Negotiated physical link speed | Compare with client capability and operating conditions | Link rate isn't application throughput |
| Retry rate | Share of frames resent | Compare against a healthy baseline under similar load | Retries don't identify the cause by themselves |
Treat reference readings as investigation criteria, not universal pass marks. Voice clients, handheld scanners and bulk-transfer laptops impose different requirements. Agree acceptance criteria for the actual service before declaring a room fit for use.
Strong RSSI with sustained high utilisation indicates contention. Strong RSSI with poor SNR and increased retries suggests interference or another radio problem, but needs corroboration. Weak RSSI that deteriorates consistently along a route is stronger evidence of a coverage issue.
A basic scanner may expose BSSIDs and signal strength without measuring channel airtime, retries or non-Wi-Fi energy. Mark unavailable measurements as unavailable. Don't substitute nearby network count for utilisation or describe a channel graph as a spectrum analysis.
Device inventory adds context, particularly when assessing how many devices are connected to the internet. Still, an associated device isn't necessarily an active device. A busy uploader can consume more useful airtime than a group of idle clients, so correlate the inventory with activity during the complaint.
A useful survey is a repeatable measurement procedure, not a walk around the building with a signal graph open. Another engineer should be able to follow the same route, use the same test conditions and compare the results meaningfully.
The SourceForge UK Wi-Fi analyser directory describes tools spanning scanning, surveying, monitoring and problem detection, including heat maps, historical measurements and roaming assessment. Check which of those functions your chosen edition provides.
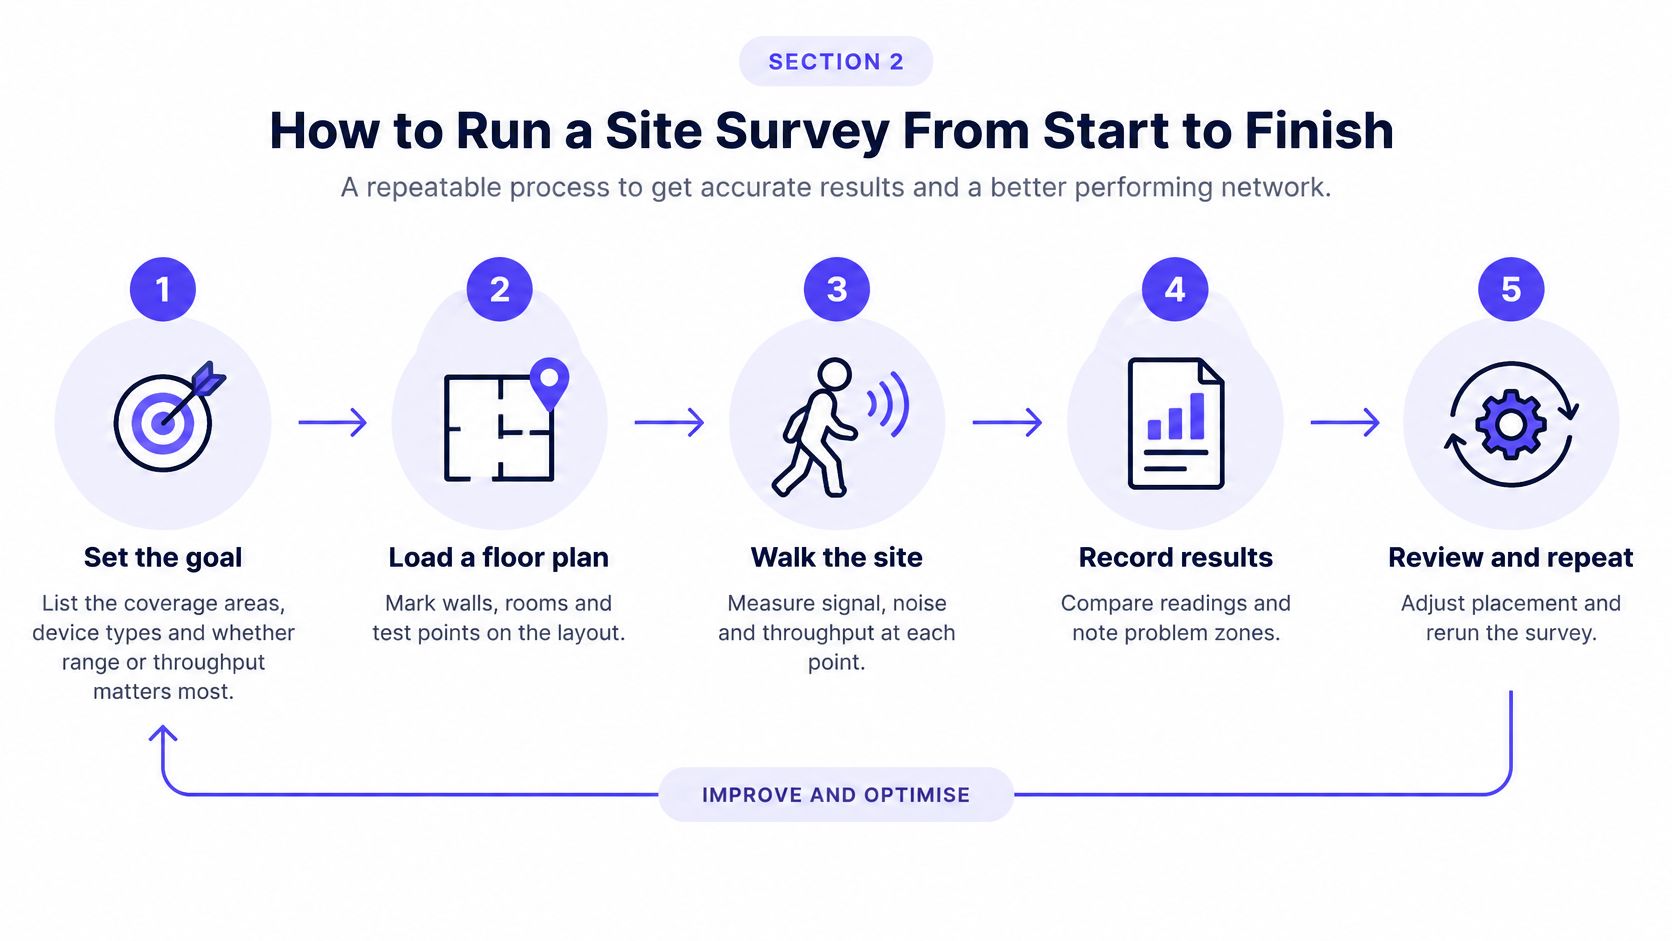
Set the service goal. List the coverage areas, client types and business applications. Specify whether success means reliable calling, roaming, transactional access or sustained throughput.
Load a scaled floor plan and mark measurement positions at work areas, doorways, stairwells and suspected obstructions. Use recognisable landmarks so the next engineer doesn't measure from a different location.
Walk the route consistently. Record RSSI, SNR, utilisation and co-channel BSSIDs wherever the tool supports them. Capture the serving BSSID and band as well, otherwise a client changing access point can make neighbouring readings misleading.
Repeat during the period when users report trouble. A quiet-building result can establish coverage, but it won't reproduce competition from staff, visitors and neighbouring tenants.
Review band suitability. Assign throughput-sensitive clients to the higher band only where their measured connection supports the workload. Keep range-constrained and legacy devices in the design rather than treating them as exceptions to ignore.
Build the heat map and annotate the exceptions. Mark dead spots, unexpected associations and overlapping channel plans, but remember that software interpolates between your measured positions.
Change a variable, then retest. Adjust channel, power or access-point position separately and revisit the same locations. Changing everything together prevents the team from identifying which intervention helped.
Save the dated baseline with the floor plan, configuration and test-device details. Include the application version and measurement limitations so later comparisons have context.
On the lower band, use a conventional non-overlapping channel plan rather than choosing a visually empty channel between established allocations. Assess co-channel signal strength and measured airtime together; the smallest BSSID count isn't automatically the best choice.
On the higher band, check DFS status, client compatibility and channel width before expanding bandwidth. Radar detection can require an access point to vacate a DFS channel, so investigate channel-change events when users report brief interruptions.
Change the configuration deliberately, then prove the result at the same measurement points.
Use historical recording and roaming tests to extend the baseline beyond static coverage. A device may perform well while stationary yet struggle during a call as it moves between access points.
The analyser says the signal is excellent, yet video calls still freeze. That isn't a contradiction. The client may hear the access point clearly while suffering congestion, gateway delays, upload saturation or a fault beyond the premises.
Keep local radio, gateway reachability and broadband service separate. A wireless test to the gateway includes the radio path, so a poor result doesn't automatically prove that the router itself is faulty.
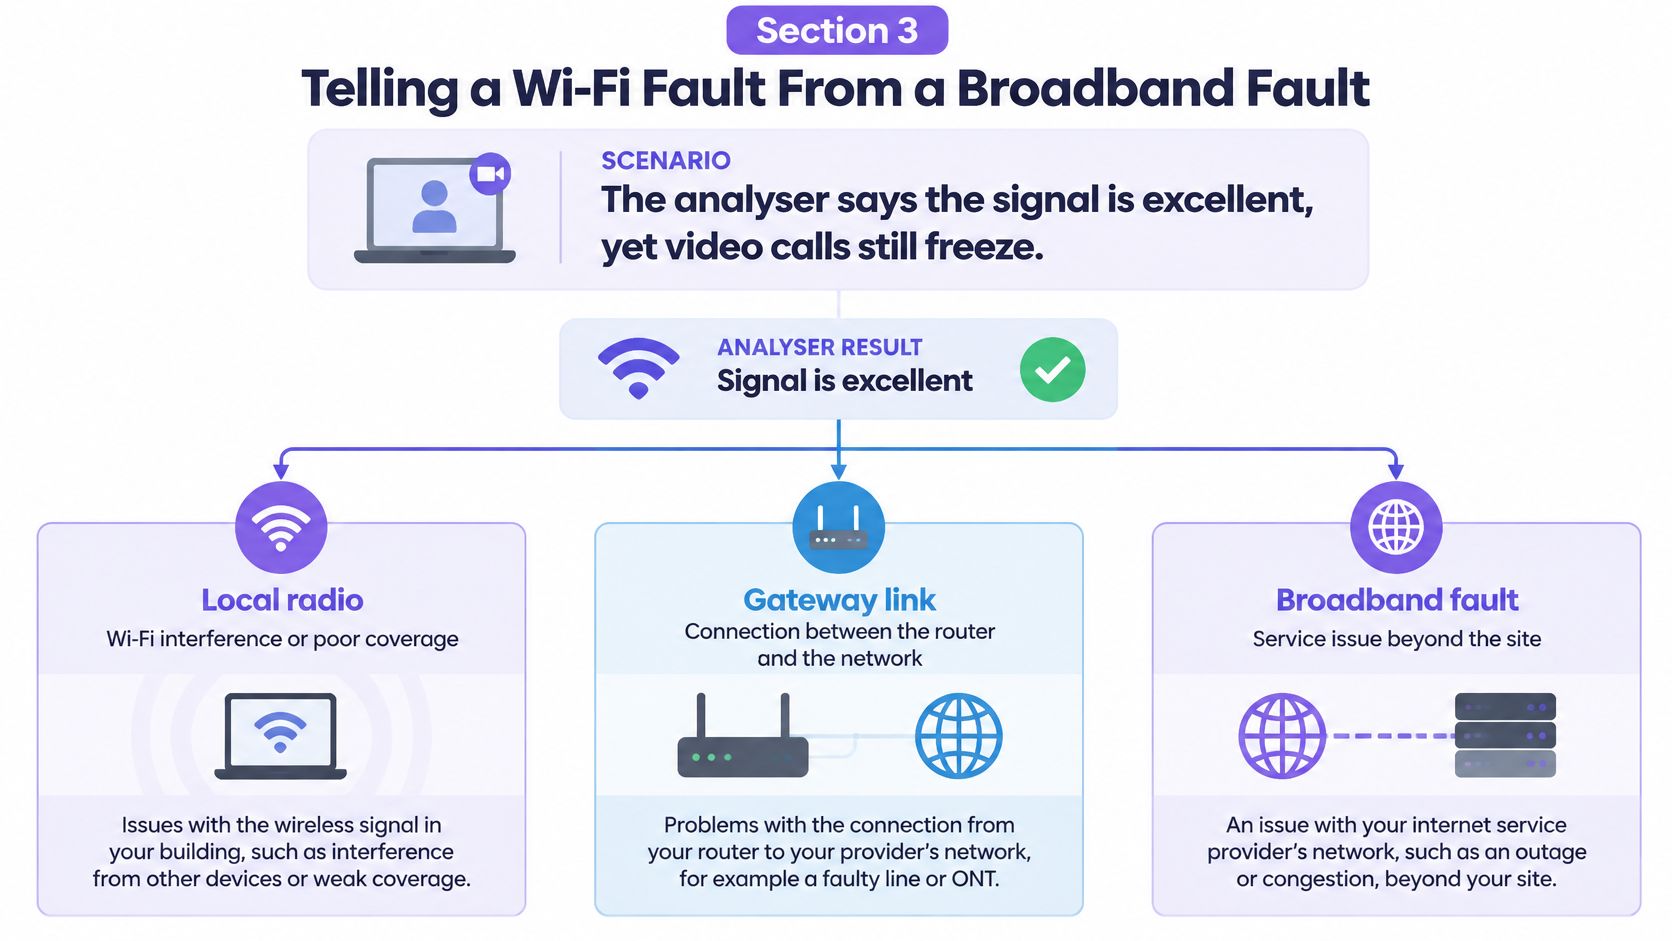
Fault domains, tests and the readings that point to them
| Fault domain | Test to run | Reading that points there |
|---|---|---|
| Local radio | Channel utilisation and SNR at the device | Busy airtime or poor SNR coinciding with the failure |
| Gateway link | Latency and packet loss to the router, compared over wireless and Ethernet | Rising latency or packet loss to the router |
| Broadband service | Wired download and upload against contracted expectations | Repeated wired results well below expected service performance |
| Upload path | Upload performance and latency under a representative workload | Upload stalls or latency rises while download appears healthy |
Run comparable tests from the affected client and a wired connection. If gateway reachability deteriorates only over wireless, investigate the radio and client path. If it deteriorates over Ethernet too, check the local switching, cabling and gateway before escalating to the provider.
Internet tests need similar discipline. Record the endpoint, competing traffic and whether the customer was uploading or downloading during the test. A remote test server or an overloaded client can produce a poor result without proving an access-line fault.
Ofcom reported in January 2025 that 25.9 million UK homes, 86%, could access gigabit-capable broadband, while 48,000 premises still lacked access to decent broadband, defined as at least 10 Mbit/s download and 1 Mbit/s upload, in its Nations Report 2025. Availability doesn't establish what a customer bought or what their connection delivers during a fault.
Pay particular attention to upload performance. Cloud backup, camera traffic and calls can compete in that direction while a download-only test looks reassuring. Test latency under load as well as transfer speed.
For a faster network, diagnose in order: inspect the local radio, test gateway reachability, then compare wired broadband performance. Finding a fault in a domain doesn't certify the others as healthy, and changing channels won't repair an upstream service problem.
Business selection is about repeatable evidence and operational fit, not a generic best-channel score. Test shortlisted applications against an existing trouble ticket before committing the engineering team to them.
Ofcom describes approximately 83 MHz available for Wi-Fi at 2.4 GHz and 585 MHz at 5 GHz in its Northampton airborne measurement document. That makes band-aware reporting a practical requirement, although more spectrum alone doesn't establish a better client experience.
Procurement check: Have a different engineer reproduce the assessment using only the saved project and handover notes.
When packaging Wi-Fi solutions for businesses, separate survey capability from access-management capability. A useful commercial proposal explains which tool measures the environment, which service controls access and who owns ongoing validation.
Consider a hypothetical office where staff report dropped calls near a stairwell and slow laptops after lunch. An engineer surveys before occupancy and again during the complaint period, using the same client and marked floor-plan locations.
The quiet survey reveals a weak serving signal near the stairwell. During the busy period, the engineer also records sustained contention on the lower band. These are separate findings, so the remediation shouldn't collapse into a blanket router replacement.
The engineer tests moving capable laptops to the higher band where the measured link supports their workload. For the stairwell area, they trial an additional access point with a suitable wired uplink, then validate its position and power settings rather than installing it where mounting is easiest.
The neighbouring network's presence is relevant, but its name on a graph isn't proof that it caused the slowdown. The engineer checks whether the busy airtime and client symptoms coincide, then retests after the configuration change.
The saved project becomes the handover record:
This is more useful than delivering a green heat map without its assumptions. It also prevents an account manager from presenting a quiet-period survey as a guarantee of busy-period performance.
Identity-based access belongs alongside the radio design, not inside its measurements. Directory-driven staff provisioning and revocation determine who may connect, while a controlled guest onboarding flow governs visitor access.
An analyser can investigate the wireless conditions underneath those services. It can't certify directory synchronisation, authorisation policy or the entire onboarding journey from an RSSI reading.
Assign owners accordingly. Network engineers maintain the radio baseline, service administrators manage access policy, and the support desk records whether a reported failure occurs before association, during authentication or after connectivity is established.
Agree a recurring re-measurement schedule and trigger additional checks after layout changes or access-point moves. Stored baselines let the partner demonstrate what changed and whether the intervention worked, rather than comparing unrelated screenshots.
Baseline a representative site before buying hardware, expanding a contract or promising performance. Choose somewhere that reproduces the customer's actual complaint, not the easiest location to survey.
Use the measurements to decide what to purchase. A tool earns its place when engineers can collect reliable evidence, isolate the likely fault and hand the result to someone else without a verbal reconstruction of the visit.
Keep the baseline dated and preserve the configuration used for the acceptance test. The first re-measurement should establish whether the intervention improved the reported experience under comparable conditions.
Don't promise that an analyser will explain everything. Promise a disciplined process that separates what the tool measured from what still needs testing. Measure the environment first, then manage who gets on to it.
Purple offers identity-based staff, guest and multi-tenant Wi-Fi access over existing infrastructure, complementing the radio measurements collected during a survey. Visit Purple to explore partner options for adding controlled onboarding and directory-driven staff access to a measured, validated wireless deployment.
Join 80,000+ venues already running on Purple. No targets, no minimums, just bigger deals.